Using GNU's GDB Debugger: Introduction
By Peter Jay Salzman
What Is A Debugger?
A symbolic debugger is an application that runs your program, just like you
can, when you type the name of your program. The difference is, a debugger can
step through your source code, line by line, executing each line only when you
want it to. You can even step through your program machine instruction by
machine instruction (try that with printf())! At any point, you
can inspect and even change the value of any variable at run-time. If your
program crashes, a symbolic debugger tells you where and why the program crashed
so you can deduce what went wrong. You can go through the program and see what
source code lines get executed and in what order.
Do you have an infinite loop? No problem! Use a debugger to step through
the loop and see why your conditional fails to do what you had expected. Did
the program crash on a variable access? No problem! The debugger will tell you
all sorts of information about the variable you tried to access and the value
you assigned (or perhaps didn't assign) to it. Is there a line in your code
which isn't executing? No problem! Use the debugger to see what gets executed,
in what order, and why a particular line isn't getting reached! Other than a
compiler, the debugger is the most useful tool a programmer can use.
Why Not Use printf()?
Most people use the printf() debugging method. This is called
adding "trace code" to your program. Simply put, they sprinkle their code with
printf() to view the value of variables at certain strategic points and
also to examine the order of execution of lines of source code.
There are a few reasons why this may not be the best way of doing things:
- Sometimes you need a lot of printf()'s, and it can get tedious
putting them in and taking them out. Inserting and deleting superfluous
code all the time is really distracting. It draws attention away from what
you're doing. It's like trying to implement a linked list while someone is
talking to you about last night's Futurama episode.
- A symbolic debugger can do an awful lot that printf() can't. You
can do just about anything you can think of, including changing the value of
variables at run-time, halt the program temporarily, list source code, print
the datatype of a variable or struct that you don't recognize, jump to an
arbitrary line of code, and much, much more.
- You can use a symbolic debugger on a running process; you don't even have
to kill the process! Try that with printf()!
- You can use a symbolic debugger on a process that has already crashed and
died without having to re-run the program. You'll see the state the program
was in at the time of death and can inspect all the variables.
- A knowledge of GDB will increase your knowledge of programs, processes,
memory and your language of choice.
You'll be able to find and fix your bugs faster using a symbolic debugger
like GDB. However, this isn't to say that printf() has no use in
debugging. Sometimes it's the best way to go. However, for real code, a
debugger can almost always get the job done orders of magnitude faster and
easier. And using a debugger is always more elegant, and if you don't
care about elegance, you should quit programming on Linux and start using Visual
C++.
What Is GDB?
In the previous section I told you what a symbolic debugger is. There are
actually MANY symbolic debuggers, and in the next section I'll mention some of
them. However, this tutorial is about one particular debugger which I use,
called GDB.
GDB is a debugger which is part of the Free Software
Foundation's GNU operating system. Its original author is Richard M.
Stallman (affectionately known as "RMS", one of
the finest heroes of the free software movement), and has a long and impressive
list of contributors, including some interesting corporate sponsorship for support under various
architectures. It's a wonderful piece of software and outclasses nearly every
other debugger I've seen, including commercial ones.
GDB can be used to debug C, C++, Objective-C, Fortran, Java and Assembly
programs. There's partial support for Modula-2 and Pascal. It'll run on any
architecture you can think of that supports Unix, so learning GDB on your home
PC will give you the power to debug code anywhere Unix can run!
Way back when, dbx was the canonical debugger people used on Unix systems.
With the advent of GNU being the standard by which all Unix systems are
measured, GDB became the canonical debugger of the debugging world. As a
result, even commercial debuggers have a tendency to be command compatible (or
even idea compatible) with GDB, so learning GDB will enable you to use a whole
slew of other debuggers. In short, if you learn GDB, you will be able to debug
anything almost anywhere with any debugger in the Unix world.
GDB's homepage is located at www.gnu.org/software/gdb/gdb.html
and as of Oct 2016, is up to version 7.11. Nov 2006, is up to version 6.4.
GDB is copyleft software (meaning that not only is GDB free software, but all publicly
released derivatives and enhancements people make to GDB must also be free) and
is licensed under the GNU GPL
.
Other Symbolic Debuggers
This section documents other debuggers, both actively developed and long
gone. I give a short history when the information is available. Any additions
(history, debuggers not listed here, other front ends, screenshots), please let me know.
Debuggers
- The first debugger that I know of was called dbx, and like GDB, was command
line driven. The text UI of GDB was written to resemble dbx, although the
two debuggers are not command line compatible. Other symbolic debuggers were written
so that their UI resembled dbx (or GDB) as well. For this reason, you'll
find many command line debuggers to be quite similar. If you learn to use
GDB, you'll largely be able to navigate through most other debuggers.
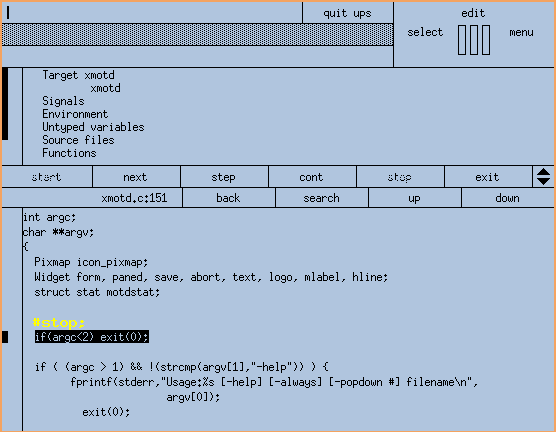
- ups is another debugger originally
developed by Mark Russell but is now updated by Rod Armstrong. It also
comes with its own theme song.
Ups includes a C interpreter which allows you to add fragments of code simply
by editing them into the source window (the source file itself is not
modified). Perversely, this lets you add debugging printf() calls
without recompiling, relinking or even restarting the target program. ups
supports C, C++ and limited FORTRAN debugging on SunOS, Solaris, Linux and
FreeBSD. Screenshots: old,
new.
- The Portland Group sells an excellent
high-quality GUI debugger named pgdbg. pgdbg specializes in debugging all kinds of parallel code on
many different kinds of clusters (distributed memory, SMP servers, etc).
While pgdbg is a very high-powered debugger, it's also expensive. Screenshot.
Front Ends
- xwpe. Screenshot.
- The most popular GDB front end is DDD, the Data Display Debugger which uses the
Motif widget set. DDD has some nice features: it can give you graphical representations of linked lists, ADT's and trees.
In addition, DDD is a front end to the Python, Java and Perl debuggers as well. I personally don't use DDD much, but I
still appreciate it. DDD used to be quite buggy. Over the years it has stopped crashing regularly(!) on me, but as of
March 2003, still crashes on a blue moon. In addition, the pop-up command tool definitely has "issues" with window
managers that have multiple screens, like Enlightenment.
- tgdb is a Tcl/Tk front end for GDB first written in 1994 by a company named HighTec EDV-Systeme GmbH, in Germany. It
was shareware (asking price was $30). Development and support seems to have ended many years ago. It shouldn't be
confused with "trivial gdb" which is also called tgdb. Does anyone have a screenshot?
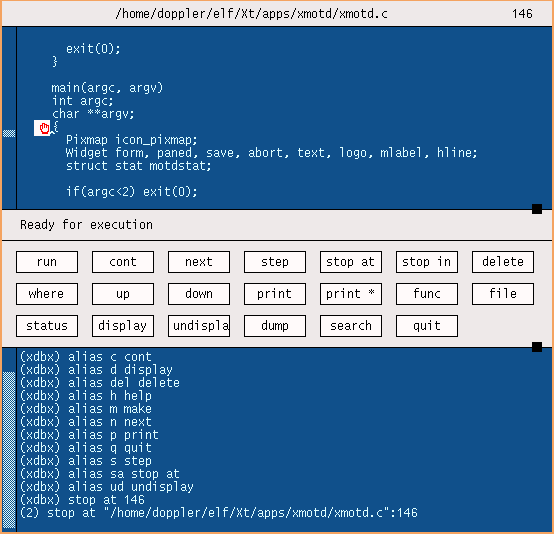
- xdbx is a front end to dbx that was created by Po Cheung of Microelectronics and Computer Technology Corporation (MCC)
in March 10, 1989. It uses the old X Athena widget set (libxaw). It has its own license which is open source but not
copyleft. Development died a long, long time ago. Screenshot.
- xxgdb is a front end to GDB that was created in December 1990 by Pierre Willard. It has its own license which is open
source but not copyleft. It's built from the source code for xdbx; basically, xxgdb is xdbx adapted to GDB instead of dbx.
xxgdb uses the old X Athena widget set (libxaw). It currently doesn't run on any system that uses unix98 posix TTYs.
Development died in 2002. It most likely doesn't work with current versions of GDB. Screenshot.
- mxgdb is a Motif based front end for GDB written by back in January 3 1992. mxgdb is based on xxgdb: Jim ported xxgdb from the
Athena widget set to the Motif widget set (in turn, xxgdb was a GDB port of xdbx). It's licensed under the GNU GPL and was
last maintained (I think) by Robert Stockmann. It most likely doesn't work with
current GDB versions. Does anyone have a screenshot?